Computer model uses cellphone data to predict COVID-19's spread in US cities
A team of researchers from Stanford and Northwestern universities have created a computer model that predicts how COVID-19 spreads in cities by studying anonymized cellphone data from 98 million Americans in 10 major cities.
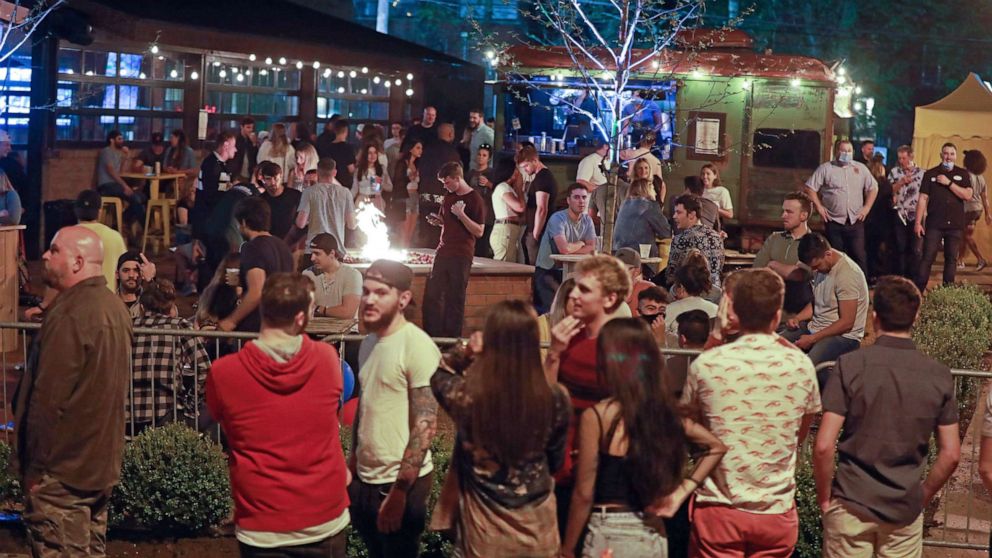
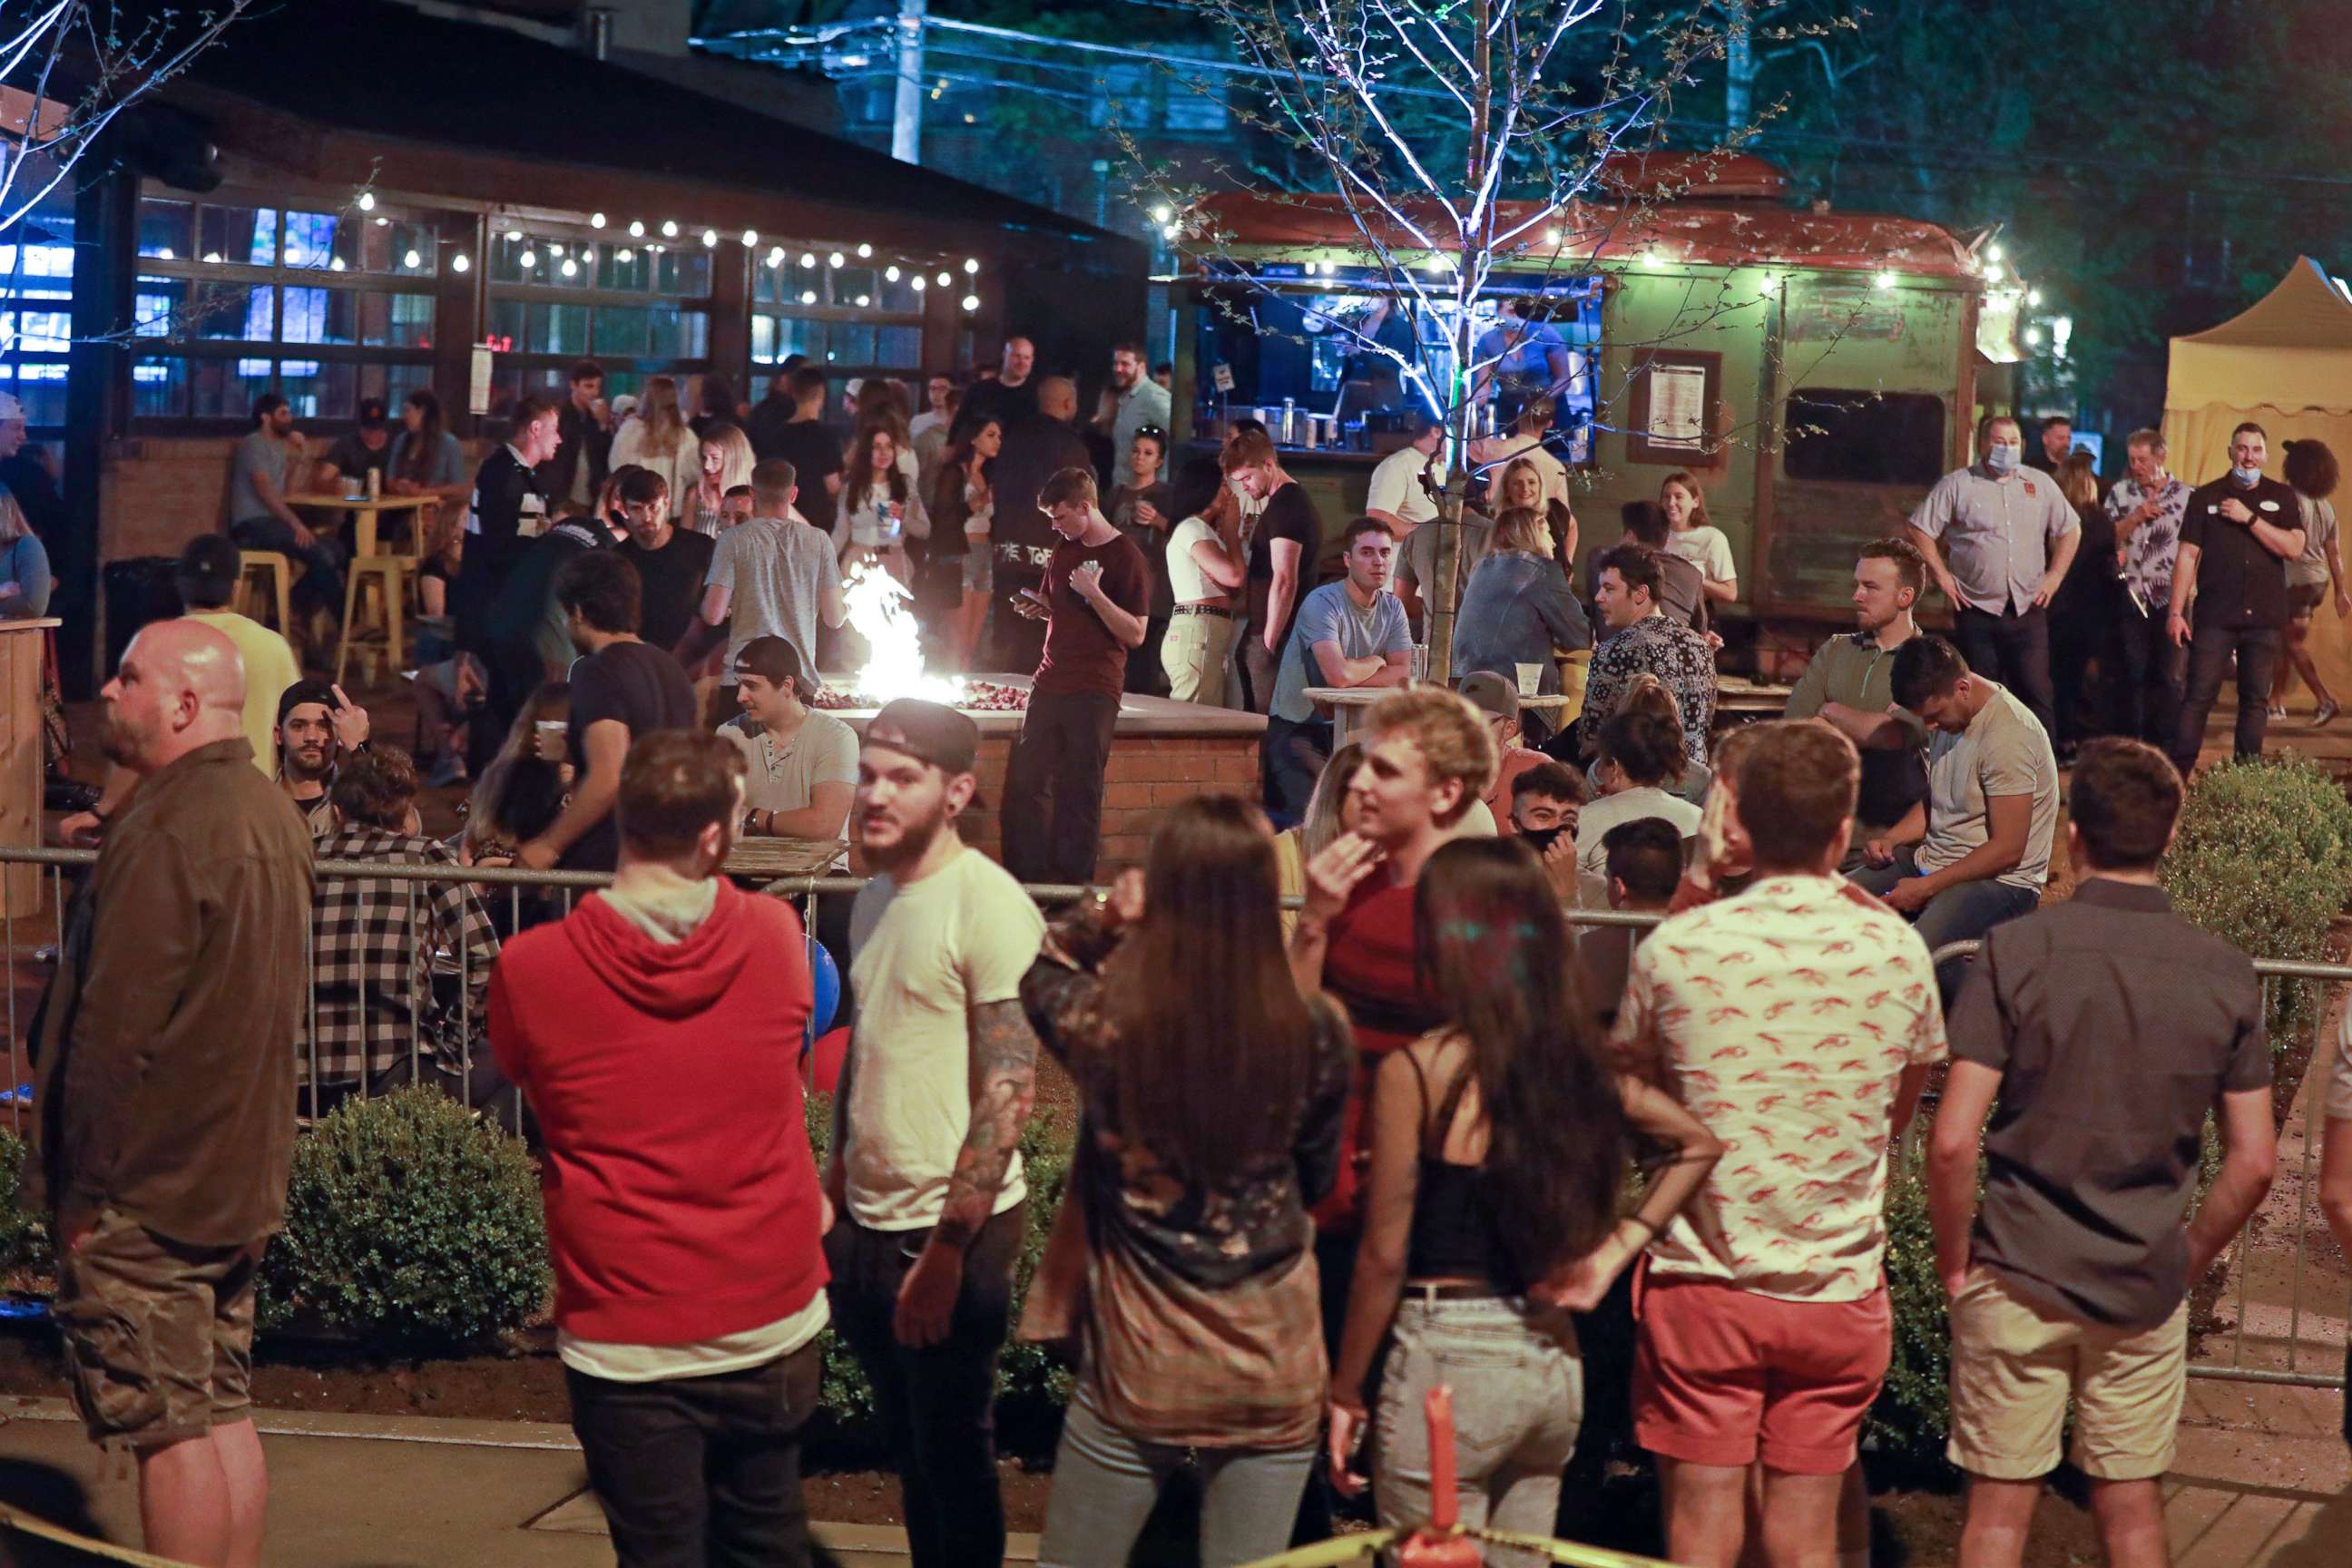
Their findings indicate that most infections occur at so-called super-spreader sites where people are in contact for long periods of time, such as at restaurants or gyms that have reopened at or near full capacity. Researchers said the model also can help explain some of the reasons COVID-19 has hit communities of color particularly hard.
The new research comes at a time when new COVID-19 cases in the U.S. are surging across the country and cities have struggled to quell the virus's spread -- shutdown and reopening plans have varied and had varying degrees of success as local officials have struggled to balance health risks with economic losses.
"What our model can do is start to inform the public and policymakers on where we fall on this tradeoff, and how many visits and how many infections would occur at each level of reopening," Serina Chang, the co-first author of the paper and a Ph.D. student at Stanford University, told ABC News.
"Reopening fully is quite dangerous, but there's a lot we can do in between reopening fully and shutting down," she said. "It doesn’t have to be all or nothing."
Chang said their model has shown that if you reopened all venues at 20% capacity in Chicago, you would lose about 40% of the visits you could have had, but you're able to reduce new infections by 80%.
"There's this in-between zone that can strike a good balance between economic activity as well as the health of the population," Chang said. "If you reduce visits by a little bit, you can reduce infections by a lot."
The researchers published their findings earlier this week in the journal Nature and expressed hope that it can be used by officials to better inform reopening plans.
In the past, these disparities have been assumed to be driven by preexisting conditions and unequal access to health care, whereas our model suggests that mobility patterns also help drive these disproportionate risks.
The model also helps explain health disparities with the virus among varying socioeconomic groups.
"Lower income and less-white neighborhoods were not able to reduce their mobility as much," Chang noted, citing mobility data broken down by census block groups. "We hypothesize that this is because lower income and less white individuals tend to be overrepresented in essential work jobs and less likely to be able to work from home."
Moreover, many of the everyday places that people from lower income neighborhoods went to tended to be smaller in square footage and more crowded, the researchers found.
Grocery stores in lower income neighborhoods were "on average, two times more dangerous than a visit to the grocery store of a higher income individual," according to Chang.
Co-author David Grusky, a professor of sociology at Stanford, added in a statement: "In the past, these disparities have been assumed to be driven by preexisting conditions and unequal access to health care, whereas our model suggests that mobility patterns also help drive these disproportionate risks."
The model was built looking at data from the first wave of U.S. COVID-19 infections in spring and early summer. The researchers studied New York, Los Angeles, Chicago, Dallas, Houston, Atlanta, Miami, Philadelphia, San Francisco and Washington, D.C.
The cellphone location data came from a collaboration with the company SafeGraph, which aggregated and anonymized location data from cellphone applications and provided it to the researchers. The data showed which places people visited each day and for how long, and the square footage of the establishments.
The researchers have made their data publicly available so others can replicate it and currently are working on developing it into a more user-friendly tool for policymakers and health officials.